News:
Brokerage
Posted: March 23, 2015
U.S. office investment hits largest full-year total since 2007 according to CBRE Group, Inc.
Increased demand for office space, the strongest labor market since 1999 and continued strong interest from investors combined to drive the largest full-year office investment total since 2007, according to the latest research from CBRE Group, Inc.
Total investment volume in U.S. office properties totaled $119 billion in 2014, a 15% climb over the prior year. The year closed with a very active quarter for office property investment, in terms of sales volume. In Q4 2014, U.S. office sales volume reached $35.6 billion—13% higher than Q3 2014. Despite the steady climb in office property acquisitions over the last several years, the 2014 figure was 44% below the prior peak of 2007.
Relative to other property types, foreign capital was particularly focused on the office sector, acquiring $17 billion of U.S. office assets in 2014—representing 45% of foreign investment in U.S. commercial real estate. Within the office sector, foreign capital leaned toward central business district (CBD) properties, with 80% of it going to such assets. Canada, Norway and Hong Kong were the largest sources of international investment capital in 2014, with New York and Boston the leading markets for foreign office investment.
"The U.S. office market remains a safe haven for foreign investors looking to make their way into the U.S. In 2015, we anticipate total office investment will rise roughly 15%," said Jeanette Rice, Americas Head of Investment Research, CBRE.
U.S. office leasing metrics were also strong, with net office absorption totaling 15.4 million s/f for the quarter, and 52.7 million s/f for the year—the best performance since 2007 and well exceeding the long-term average of about 40 million s/f
"The U.S. office market ended the year on a strong note," said Sara Rutledge, Director of Research and Analysis, CBRE. "Office space demand was supported by the tightest labor market conditions seen during the recovery and healthy GDP growth. Looking ahead, the U.S. economy should continue to improve, with tailwinds to consumer spending outweighing headwinds to exports and capital spending. As a result, office market fundamentals should continue to tighten."
The U.S. office vacancy rate declined another 20 basis points (bps) in Q4 2014, to 13.9%, which was down 100 bps from year-end 2013. Downtown and suburban vacancy mirrored the overall quarterly decline, falling by 20 bps each, to 11.1% and 15.5%, respectively.
Gross asking rental rates for office space continued their steady rise in Q4 2014, averaging $28.30 per s/f at year-end. Following 15 consecutive quarters of rising rents, the U.S. average ended 2014 only 2.4% below its 2008 prior peak.
The largest increase in office investment activity in 2014 came from private, non-institutional U.S. investors, a category that includes non-traded REITs. This group acquired $38 billion of office assets—an increase of 26% over 2013. Investment by public REITs also rose substantially—by 13% to $15 billion.
Trends in cap rates and sales price per s/f also reflect the large amount of capital coming into the sector, as well as the continued improvement in market performance. Over the year ending Q4 2014, cap rates dropped 30 bps to an average of 6.7% for all types of office assets.
Total completions of multi-tenant office buildings rose to 8.8 million s/f in Q4 2014, for an annual total of 22.3 million s/f, which was only half of the long-term average. However, office construction is gaining momentum nationally and across more markets. Office space under construction totaled 88.7 million s/f at year's end, with 20 markets now experiencing activity at 2% or more of standing inventory.
Tags:
Brokerage
MORE FROM Brokerage
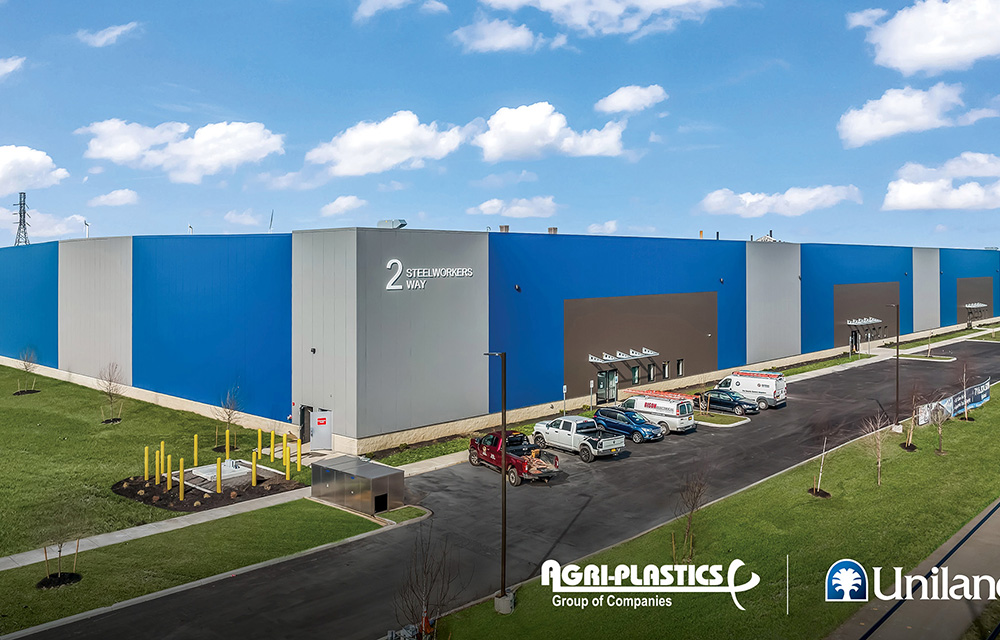
Hanna Commercial Real Estate brokers Agri-Plastics 64,000 s/f manufacturing facility lease at Uniland’s 2 Steelworkers Way
Lackawanna, NY Agri-Plastics, a global leader in the manufacturing of plastic products for agricultural, industrial, recreational, environmental, and home industries, has signed a 64,000 s/f lease to open a

Quick Hits
Columns and Thought Leadership

Strategic pause - by Shallini Mehra and Chirag Doshi
Many investors are in a period of strategic pause as New York City’s mayoral race approaches. A major inflection point came with the Democratic primary victory of Zohran Mamdani, a staunch tenant advocate, with a progressive housing platform which supports rent freezes for rent
AI comes to public relations, but be cautious, experts say - by Harry Zlokower
Last month Bisnow scheduled the New York AI & Technology cocktail event on commercial real estate, moderated by Tal Kerret, president, Silverstein Properties, and including tech officers from Rudin Management, Silverstein Properties, structural engineering company Thornton Tomasetti and the founder of Overlay Capital Build,

Lasting effects of eminent domain on commercial development - by Sebastian Jablonski
The state has the authority to seize all or part of privately owned commercial real estate for public use by the power of eminent domain. Although the state is constitutionally required to provide just compensation to the property owner, it frequently fails to account

Behind the post: Why reels, stories, and shorts work for CRE (and how to use them) - by Kimberly Zar Bloorian
Let’s be real: if you’re still only posting photos of properties, you’re missing out. Reels, Stories, and Shorts are where attention lives, and in commercial real estate, attention is currency.




.jpg)

.gif)