


 New York, NY NYREJ recently sat down with Shimon Shkury, founder and president of Ariel Property Advisors, a New York City investment real estate services and advisory company, who shared some of the highlights from Ariel Property Advisors’ “Multifamily Quarter in Review New York City: Q3 2018.”
Q: How did the multifamily market perform in the third quarter?
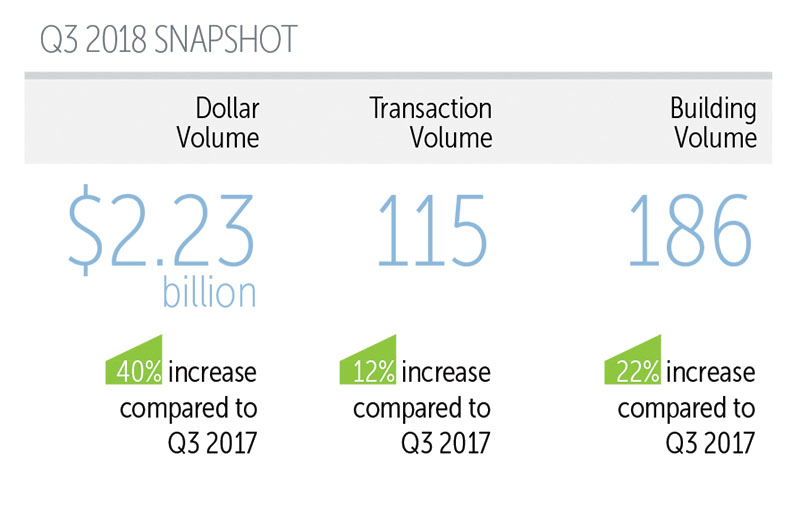
A: The New York City multifamily market performed well in the third quarter, with all three volume metrics recording gains on a year-over-year basis. Dollar volume surged to over $2 billion for a fourth consecutive quarter as large and institutional-caliber deals continued to make a comeback.
From July through September, New York City saw 115 multifamily transactions comprised of 186 buildings totaling $2.23 billion in gross consideration. On an annual basis, this represents a 40% jump in dollar volume, a 12% rise in transaction volume and a 22% surge in building volume. Compared to the second quarter, dollar volume fell 7%, while transaction and building volume rose 6% and 9%, respectively.
Q: What drove dollar volume in the third quarter and how did multifamily prices hold up?
A: The sharp climb in dollar volume can largely be attributed to the 100% year-over-year increase in institutional-level transactions that exceeded $100 million, which altogether totaled $609.10 million in aggregate value. Dollar volume was decisively driven by Manhattan, with the borough’s $1.12 billion in sales accounting for nearly half of New York City’s tally.
Brooklyn saw the most sales in the third quarter, comprising 30% of New York City’s transaction volume. The Bronx was not far behind, snaring a 28% share. Queens saw the most significant year-over-year gains for all three volume metrics.
Pricing indicators based on a trailing 6-month average held relatively steady across all sub-markets. (For pricing metrics on all New York City sub-markets, see page 6 of APA’s report, available at http://arielpa.com/report/report-MFQIR-Q3-2018)
Q: How did the submarkets perform?
 A: On a sub-market level, Manhattan fared exceptionally well in 3Q, with dollar volume nearly equal to all the other sub-markets combined. For the quarter, Manhattan saw $1.12 billion in gross consideration, representing a quarter-over-quarter and annual gain of 154% and 69%, respectively. Large deals reigned in the borough, with 77% of the dollar volume and 38% of the transaction volume attributable to properties that sold for over $20 million.
In terms of pricing, the average price per s/f in Manhattan, based on a trailing 6-month average, fell 2% year-over-year to $921. Average cap rates rose to 3.67% from 3.53%.
Northern Manhattan struggled during the quarter as it was the only sub-market to record across-the-board declines in all three volume metrics on both a quarterly and annual basis. During 3Q, 11 transactions involving 17 buildings were recorded for an aggregate value of $119.66 million, representing declines of 21%, 11%, and 31% versus the previous quarter. On a year-over-year basis, transaction, building, and dollar volume fell 45%, 35%, and 61%, respectively.
Northern Manhattan’s average price per s/f, based on a trailing 6-month average, fell 3% year-over-year to $381. The average cap rate fell to 3.96% from 4.01%.
The Bronx enjoyed a banner 3Q given it was the only sub-market to notch quarterly and annual gains for every volume metric. In total, the borough saw 32 transactions involving 58 buildings for a total consideration of $334.38 million. On a year-over-year basis, these figures represent increases of 60%, 41%, and 68% in transaction, building, and dollar volume, respectively.
Pricing metrics held firm in The Bronx, with the average price per s/f, based on a trailing 6-month average, rising 11% year-over-year to $221. Cap rates held steady, averaging 4.99% compared to 4.96%.
Brooklyn dominated sales activity in the third quarter as it was the most transactional sub-market. In total, the borough saw 35 sales that included 56 buildings for a total consideration of $561.32 million. Versus the third quarter of 2017, these figures represent increases of 9%, 22%, and 51% in transaction, building, and dollar volume, respectively. On a quarter-over-quarter basis, transaction volume rose 3%, while building and dollar volume fell 19% and 59%, respectively.
Brooklyn showed softness in pricing, with the average price per s/f, based on a trailing 6-month average, falling 7% year-over-year to $367. Cap rates averaged 4.66%, up from 4.25%.
Queens saw lackluster activity in 3Q, registering the lowest dollar volume of any sub-market and matching Northern Manhattan as the least transactional. During 3Q, 11 transactions including 14 buildings totaled $93.33 million in gross consideration, representing declines of 39%, 44%, and 67% versus the previous quarter.
Queens recorded across-the-board declines in pricing metrics, with the price per s/f averaging $355, down 7% year-over-year. Cap rates averaged 4.44%, up from 4.05%.
On a neighborhood level, the Upper East Side and Upper West Side were far and away the most transactional neighborhoods in Manhattan, with a combined 21 sales. Central Harlem and Hamilton Heights saw the most sales in Northern Manhattan, while Morrisania dominated in The Bronx.
In Brooklyn, Flatbush dominated transaction volume with 12 sales, while East New York topped dollar volume, with $906.49 million in sales across two transactions. Astoria led sales volume in Queens, with five transactions. Elmhurst led dollar volume, with $153.05 million in sales involving four transactions.
Q: What do you see on the horizon for the multifamily market this year and 2019?
A: This past year can be characterized by the return of larger, institutional transactions as they were nearly non-existent in 2017. The outer-boroughs will continue to provide for alternative institutional investments. Our expectation is that transaction volume will stay steady or even increase in 2019. We see downward pressure on pricing and believe that higher transaction volume will add to this pressure in 2019.
Sellers will continue to face increasing pressure related to refinancing in a higher interest rate environment and increasing expenses. Also, the market for development sites and conversions should see a boost in areas that have been rezoned and/or designated as “Economic Opportunity Zones.”
Q: Where can we get a copy of this report?
A: Ariel Property Advisors’“Multifamily Quarter in Review New York City: Q3 2018” and all of our research reports are available on our website at http://arielpa.nyc/investor-relations/research-reports.
Shimon Shkury is the founder and president of Ariel Property Advisors, New York, N.Y.
Sign up is quick, easy, & FREE.