
News:
Brokerage
Posted: March 5, 2019
A look at the Rudder Property Group’s office condo report - by Michael Rudder

Rudder Property Group
At a Glance
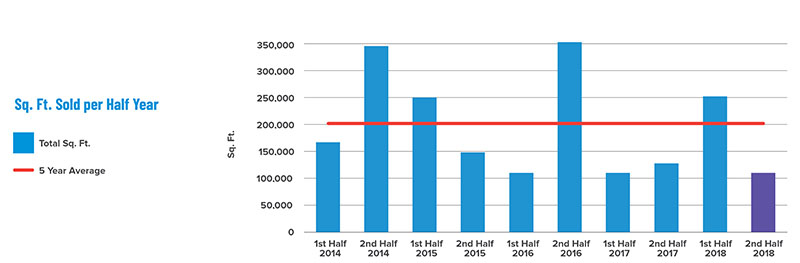
 After a robust first half of 2018, there was an expected slide in the velocity of office condominium sales in the second half of the year. The total s/f sold in the second half of 2018 was 54% less than the first half of the year, and the total dollar value of sales was 56% less.
Pricing remains strong. In the second half of 2018, the average price per s/f was $901. The average price per s/f was 15% higher than the five-year average of $786.
The insatiable demand for office space from Google, Facebook and others is making it difficult for businesses to survive. With large corporate tenant expansions, availability rates are shrinking and rents are spiking, resulting in smaller businesses being squeezed out. Purchasing an office condominium is the best way for businesses to retain a Manhattan presence while benefiting from the long-term increase in value created by the strength of the office market.
Market Overview
 The Manhattan office condominium market is made up of 99 buildings, occupying a total of 10.9 million s/f . The Midtown submarket is comprised of 6 million s/f ; Midtown South is comprised of 2.8 million s/f; Downtown is comprised of 2.1 million s/f. There are 3.4 million s/f of class A office condominiums, 5.4 million s/f of class B, and 2.1 million s/f of class C.
Second half of 2018 office condominium sales: In the second half of 2018, there were 116,750 s/f of of?ce condominium sales in Manhattan, totaling $105.155 million. The sales averaged $901 per s/f. There were a total of 19 of?ce condominium units sold in 13 different buildings, averaging 6,145 s/f per sale.
Square footage of sales: The total s/f of sales was significantly lower in the second half of 2018 compared to the first half of 2018, with 116,750 s/f sold in the second half of 2018 and 253,174 s/f in the first half of 2018. The total s/f of sales in the second half of 2018 is also considerably lower than the five-year average of 200,286 s/f per half year.
Dollar value of sales: In the second half of 2018, there was a total of $105.155 million, which is less than half of the dollar of sales in the $934 per s/f average in the first half of 2018. The dollar value of sales is 33% less than the five-year average of $157.342 million.
Average price per s/f: In the second half of 2018, the average price per s/f was $901. Pricing was lower than the first half of 2018, but still significantly higher than the five-year average of $786 per s/f.
Number of sales: There were 19 sales in the second half of 2018 compared to 34 sales in the first half of 2018. The number of office condominiums sold in the second half of 2018 was also lower than the five-year average by nine sales.
 Submarket Statistics
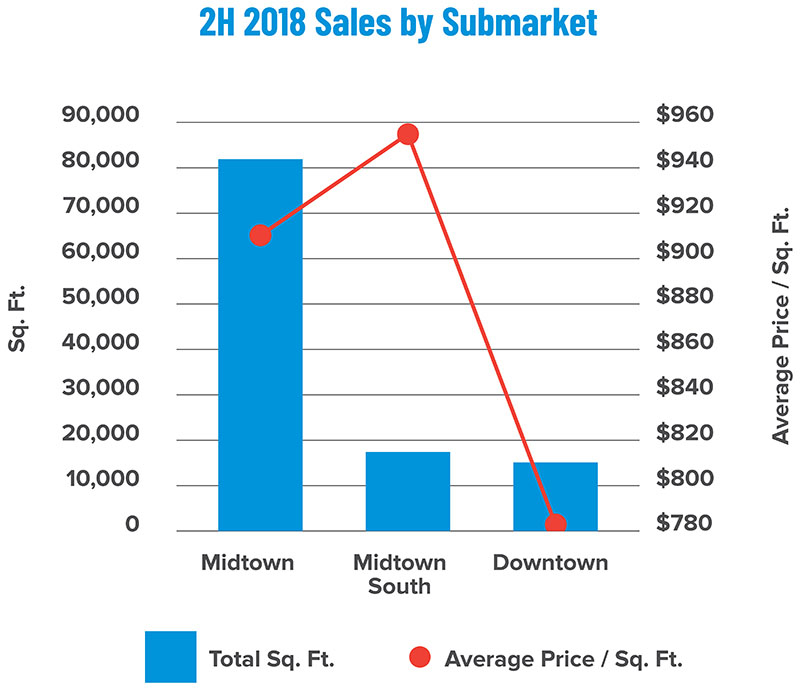
The Midtown submarket is Manhattan’s largest office condominium submarket, comprising approximately six million s/f. In the second half of 2018, there were 11 sales totaling 82,420 s/f. The dollar value of these sales totaled $75.382 million, averaging $915 per s/f.
The Midtown South submarket comprises approximately 2.8 million s/f of office condominiums. In the second half of 2018, there were five sales totaling 17,596 s/f. The dollar value of these sales totaled $16.865 million, averaging $958 per s/f.
The Downtown submarket comprises approximately 2.1 million s/f of office condominiums. In the second half of 2018, there were three sales totaling 16,734 s/f . The dollar value of these sales totaled $12.908 million, averaging $771 per s/f.
 Current Availability
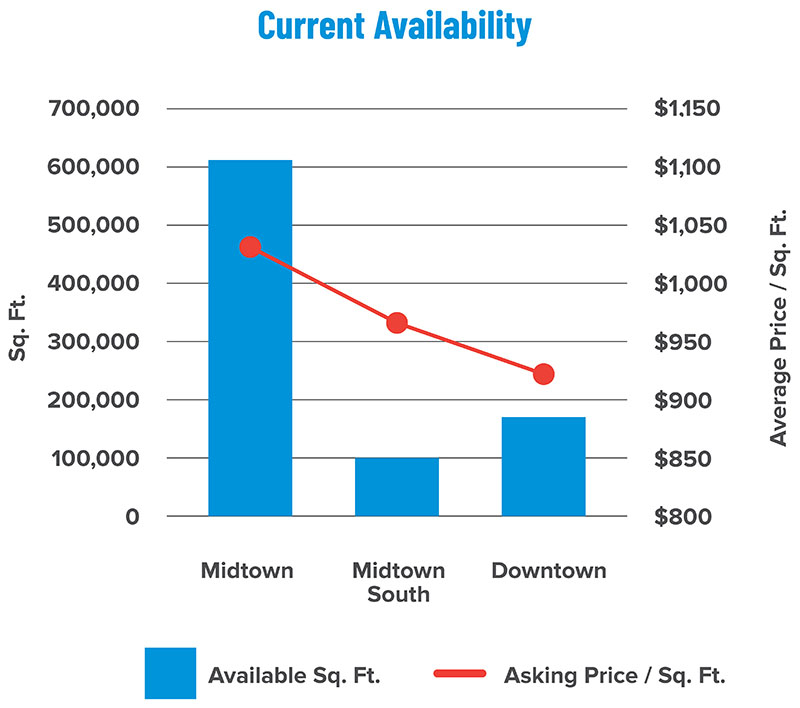
There is 886,836 s/f of available Manhattan office condominiums, which equates to an 8.1% availability rate. A total of 89 units are for sale in 44 buildings, with an average asking price of $1,014 per s/f. In the Midtown submarket, there is 610,578 s/f for sale with an average asking price of $1,043 per s/f. In the Midtown South submarket, there is 102,484 s/f for sale with an average asking price of $968 per s/f. In the Downtown submarket, there is 173,774 s/f for sale with an average asking price of $938 per s/f. The availability rate has increased by 0.7% from the first half of 2018.
The 2018 Manhattan office leasing market experienced a record year with 33 million s/f of leasing activity. Corporate behemoths such as Google, JPMorgan Chase, Pfizer, Disney and Facebook have committed to millions of s/f of office space in Manhattan.
A recent report by JLL shows that in 2018, a record high of 129 leases were signed with a starting rent of $100 per s/f or more. These $100 per s/f leases occurred in 55 buildings, totaling 46 million s/f.
This prolonged strength of the Manhattan office leasing market is making it difficult for businesses to survive. As availability rates of quality office space shrink, rents are reaching towering prices and forcing out smaller businesses while large corporate tenants are expanding.
The Manhattan office market is expected to continue to fluctuate; however, if the general trend of corporate expansion continues, then we will likely see $100+ per s/f rents will likely become the norm rather than the outlier.
How can businesses protect themselves from getting priced out? The answer is to purchase an office condominium. An office condominium offers businesses and organizations the opportunity to purchase their office space rather than rent. The annual cost of ownership is significantly less than leasing over a five- to ten-year period. By purchasing their space, unit owners are also protected from being displaced with ever-rising rents. Companies and organizations can then reap the long-term benefits of ownership, including control over space improvements, static expenses, and capital appreciation as values continue to rise.
Michael Rudder is principal at Rudder Property Group, Manhattan, N.Y.
Tags:
Brokerage
MORE FROM Brokerage

Realty Connect USA joins Better Homes and Gardens Real Estate affiliates to form one of the brand’s largest brokerages
Madison, NJ Better Homes and Gardens Real Estate LLC agreed to a landmark merger between three leading brokerages across New York, New Jersey, and Pennsylvania. The agreement brings together


Columns and Thought Leadership

Tri-state capital migrates nationally amid regulation pressure - by Reese Weaver
New York tri-state multifamily investors are increasingly reallocating capital to less-regulated markets across the U.S. as rent control and legislative risk erode returns at home. With over 60% of New York City’s rental housing stock classified as rent-stabilized, the traditional value-add model — buying under-performing buildings,

A fresh start - by Shallini Mehra and Amit Doshi
For the past several years, the New York City multifamily housing market has been defined by disruption. The combined impact of the HSTPA rent laws and a sharply higher interest rate environment has fundamentally reduced

The anticipated effect of Basel III and ISO 20022 implementation on commercial real estate - by Michael Zysman
July 1, 2025 is the deadline for US banks to begin to adopt Basel III banking standards and July 14, 2025 is the deadline for U.S. banks to adopt ISO 20022 messaging standards. Both will have a significant effect on the banking and commercial real estate (CRE) finance sectors.

The death of the generic offering memorandum: What buyers expect in 2025 - by Kimberly Zar Bloorian
There was a time when an offering memorandum (OM) was pretty bare bones, some photos, a few bullet points on income, and a rent roll thrown in at the back. That used to get the job done. Not anymore. In 2025, buyers are sharper, faster, and more selective. They’re looking
