
News:
Brokerage
Posted: February 24, 2014
NYC multifamily building sales jump 19% in 2013 according to Ariel Property Advisors' Multifamily Year in Review
The number of multifamily buildings sold in New York City jumped 19% to 1,230 and the dollar volume of those trades increased 4% to $8.87 billion in 2013 compared to 2012, according to Ariel Property Advisors' Multifamily Year in Review: New York City. Multifamily transaction volume citywide fell a modest 3% year-over-year to 675.
"New York City multifamily assets saw aggressively higher prices throughout all submarkets and pricing metrics in 2013 as demand, driven by rising rents and low interest rates, continued to outpace supply," said Shimon Shkury, president of Ariel Property Advisors. "Average capitalization rates dropped while gross rent multiples, prices per s/f, and prices per unit rose."
The most significant pricing gains occurred in Northern Manhattan and Brooklyn, which saw cap rates decline by more than 100 basis points. Manhattan and Queens also saw significant gains, but to a lesser degree.
"While Manhattan saw a dip in its multifamily volume, multifamily sales in the other submarkets surged as did their pricing, suggesting that some investors typically focused only on Manhattan are now exploring less expensive offerings elsewhere in the city," Mr. Shkury said. "Northern Manhattan and Queens, for example, had tremendous years. Northern Manhattan's multifamily dollar volume hit $1.6 billion, which is more than double 2012 and the second highest dollar volume recorded for the city. Queens had an even bigger year, with a 214% jump in dollar volume year-over-year to $1.088 billion."
Portfolios sales also dominated the market in several key neighborhoods within the city, especially Manhattan's East Village and Upper West Side; the Fordham and Mount Hope areas of The Bronx; Crown Heights and Flatbush in Brooklyn; Jackson Heights and Sunnyside in Queens; and Central Harlem and Washington Heights in Upper Manhattan.
The following is a breakdown of the 2013 multifamily data by submarket:
* Northern Manhattan. There were 116 transactions comprised of 312 buildings in Northern Manhattan, a 62% year-over-year increase in the number of buildings sold and the highest level in the city. Dollar volume for Northern Manhattan jumped 103% to $1.6 million, more than any other submarket except for Manhattan below 96th Street. Average capitalization rates dropped more than 100 basis points to 5.04% and gross rent multiples broke 11 times. The average price per s/f rose 28% to $217 and the average price per unit increased 29% to $180,404. Central Harlem led the area in sales with 36 transactions totaling 155 buildings. East Harlem saw strong values with the average price per s/f of $299, though it is worth noting that this reflects several new construction, free market buildings that sold. Investors seem to be catching on to the positive economic impact various developments like the Columbia University Expansion, Whole Foods on Lenox Avenue, and the 125th Street revitalization will have on Northern Manhattan.
* Queens. The borough's 70 transactions comprised of 133 buildings totaling $1.088 billion in gross consideration shattered sales statistics seen 2012 and 2011. Many investors who previously searched for opportunities in Long Island City and Astoria turned their attention to properties in Elmhurst, Jackson Heights and Flushing, which is reminiscent of the early migration of investors into Brooklyn neighborhoods before their real estate booms. While portfolios played a major part in 2013, for the first time a number of market rate new construction properties traded for prices previously limited only to Manhattan and prime Brooklyn. This included the sale of 41-23 Crescent Street in Astoria for $688 per s/f and 30-50 21st Street & 11-15 Broadway for $443 per s/f.
* Brooklyn. With 189 transactions comprised of 269 buildings, Brooklyn saw nearly the same number of transactions and portfolios change hands in 2013 as 2012, but the dollar volume of the trades rose 18% in 2013 to $1.2 billion. This illustrates that today's properties are achieving higher prices than last year, especially since both periods saw a large portion of sales take place in Crown Heights and Flatbush. Prices gained significantly year-over-year, as the borough wide average cap rate dropped 91 basis points to 5.75% and the average price per s/f increased 22% to $233 per s/f. Crown Heights was the most transactional sub-market with 28 transactions totaling 45 buildings. Flatbush followed closely behind with 27 sales consisting of 34 buildings, but led the borough in dollar volume with $185 million in gross consideration. Williamsburg, Park Slope, and Brooklyn Heights were among the neighborhoods with the highest prices per s/f, while Bushwick and Crown Heights saw the steepest gains compared to last year.
* The Bronx. The borough's 156 sales comprised of 264 buildings totaling $1.075 billion in consideration represented increases of 17% , 26% , and 11% from 2012 levels. Strong increases were seen in pricing as the average price per s/f hit $112 and the average price per unit rose above $105,000. Investors last year paid more to buy in the Bronx with the average price per s/f topping $112 and the average price per unit reaching $105,000. This is a long way from prices seen during the recession that were as low as $70 per s/f and $70,000 per unit. The borough's higher cap rates relative to the rest of the city continue to drive return, which is attracting yield-conscious buyers to the area. The Bedford Park section of the Bronx saw the most multifamily transactions and dollar volume with 16 transactions totaling $142 million in gross consideration.
* Manhattan. Manhattan below 96th Street recorded fewer transactions in 2013 than 2012, with transactions declining 28% to 144, building volume dipping 14% to 252, and the dollar volume of those trades falling 28% to $3.897 billion. Rising rents, limited inventory and continued low interest rates, however, led to major pricing gains in Manhattan in 2013. The average capitalization rate dropped 45 basis points from 2012 levels to 4.36% , while the average price per s/f came in at $648 and the average gross rent multiple hit 15.6. The Upper East Side and Upper West Side saw the most transactions, with 24 and 23 respective sales. In terms of total buildings, the Upper West Side led with 51 properties trading, followed by the East Village which had 33 buildings change hands, largely through portfolio deals.
The multifamily transactions included in the analysis occurred at a minimum sales price of $1 million, with a minimum gross area of 5,000 square s/f, and with a minimum of 10 units.
Tags:
Brokerage
MORE FROM Brokerage
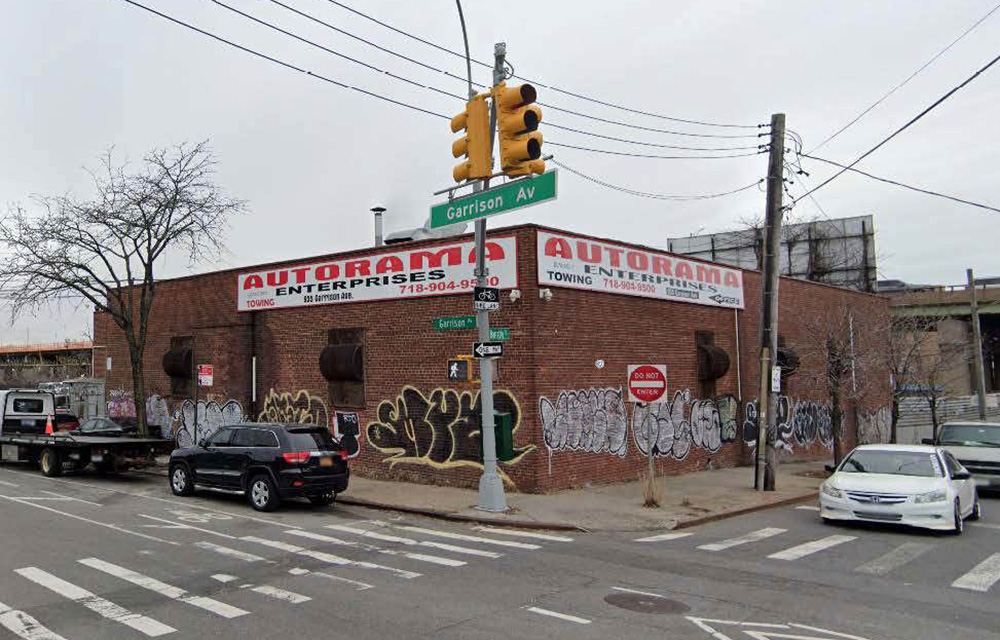
Marcus & Millichap brokers sale of $10.28 million industrial property in the Bronx
Bronx, NY Marcus & Millichap negotiated the $10.275 million sale of an industrial property at 935 Garrison Ave. “This transaction reflects both the depth of demand for NYC industrial outdoor storage


Quick Hits
Columns and Thought Leadership

The anticipated effect of Basel III and ISO 20022 implementation on commercial real estate - by Michael Zysman
July 1, 2025 is the deadline for US banks to begin to adopt Basel III banking standards and July 14, 2025 is the deadline for U.S. banks to adopt ISO 20022 messaging standards. Both will have a significant effect on the banking and commercial real estate (CRE) finance sectors.

A fresh start - by Shallini Mehra and Amit Doshi
For the past several years, the New York City multifamily housing market has been defined by disruption. The combined impact of the HSTPA rent laws and a sharply higher interest rate environment has fundamentally reduced

Tri-state capital migrates nationally amid regulation pressure - by Reese Weaver
New York tri-state multifamily investors are increasingly reallocating capital to less-regulated markets across the U.S. as rent control and legislative risk erode returns at home. With over 60% of New York City’s rental housing stock classified as rent-stabilized, the traditional value-add model — buying under-performing buildings,

The death of the generic offering memorandum: What buyers expect in 2025 - by Kimberly Zar Bloorian
There was a time when an offering memorandum (OM) was pretty bare bones, some photos, a few bullet points on income, and a rent roll thrown in at the back. That used to get the job done. Not anymore. In 2025, buyers are sharper, faster, and more selective. They’re looking
.gif)