New York City Market Report: Ariel Property Advisors shares “Multifamily Quarter in Review NYC Q2” - by Shimon Shkury

Ariel Property Advisors
New York, NY NYREJ recently sat down with Shimon Shkury, founder and president of Ariel Property Advisors, a New York City investment real estate services and advisory company, who shared some of the highlights from Ariel Property Advisors’ “Multifamily Quarter in Review New York City: Q2 2017.”
NYREJ: How did the multifamily market perform in the second quarter?
Shkury: The New York City multifamily market heated up in the second quarter, recovering sharply from sluggishness earlier in the year as investors gained confidence in the asset class. While sales volume in the city remained lower on a year-over-year basis, the pickup in activity suggests the market may have turned a corner after a period of caution.
Softness in the first quarter spilled into April, but sales activity picked up markedly in May and June, culminating with the year’s first $100 million sale, which took place in Brooklyn. Quarter-to-quarter, all volume metrics increased in every sub-market, while the city saw the most transactions since the third quarter of 2016.
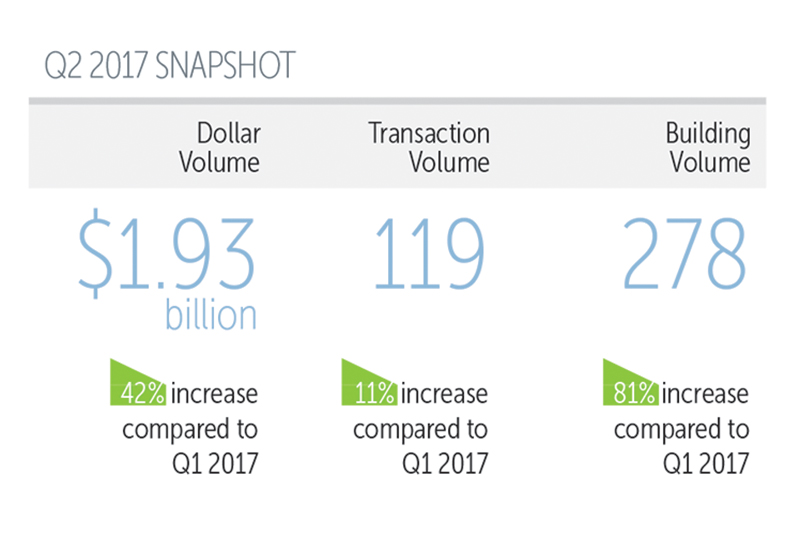
From April through June, New York City saw 119 transactions comprised of 278 buildings totaling $1.92 billion in gross consideration. This represents a 42% increase in dollar volume, an 11% rise in transaction volume, and an 81% jump in building volume compared to the first quarter, which saw 154 properties trade across 107 transactions for a total of $1.36 billion in gross consideration. However, the second quarter saw dollar volume decline 43%, transaction volume fall 35% and building volume slide 12% when compared to the same quarter last year.
NYREJ: How are multifamily prices holding up?
Shkury: Pricing in the second quarter appreciated year-over-year across all metrics in The Bronx, and Queens; while Brooklyn pricing continued to soften. After rising for three straight quarters, Manhattan cap rates bucked the trend and fell seven basis points to 3.58%, a move consistent with the strengthening of the borough’s other pricing metrics. The Bronx, meanwhile, saw prices rise the most rapidly, with price per s/f jumping more than 13% year-over-year to $197 per s/f.
Manhattan’s trailing six-month average pricing metrics in the second quarter stood as follows (year-over-year changes): price per s/f at $980 (+1.4%), price per unit at $735,447 (+5.3%), capitalization rate at 3.58% (+1.9%), and gross rent multiple at 20.31 (+3.8%).
Northern Manhattan’s trailing six-month average pricing metrics in the second quarter stood as follows (year-over-year changes): price per s/f at $394 (+9.3%), price per unit at $332,825 (+0.6%), capitalization rate at 4.08% (-0.5%), and gross rent multiple at 15.81 (-1.6%).
The Bronx’s trailing six-month average pricing metrics in the second quarter stood as follows (year-over-year changes): price per s/f at $197 (+13.3%), price per unit at $174,693 (+11.6%), capitalization rate at 4.92% (+3.1%), and gross rent multiple at 11.82 (+7.6%).
Brooklyn’s trailing six-month average pricing metrics in the second quarter stood as follows (year-over-year changes): price per s/f at $344 (-9.3%), price per unit at $299,624 (-7.4%), capitalization rate at 4.88% (-10.2%), and gross rent multiple at 15.28 (-7.5%).
Queens’ trailing six-month average pricing metrics in the second quarter stood as follows (year-over-year changes): price per s/f at $377 (+17.5%), price per unit at $286,614 (+8%), capitalization rate at 4.31% (+4.9%), and gross rent multiple at 15.16 (+8.3%).
NYREJ: How did the submarkets perform in the second quarter?
Shkury: Manhattan was energized in the second quarter after slumbering during the previous quarter, with the borough leading the city in both dollar and transaction volume, barely edging out Brooklyn in both categories. For the quarter, Manhattan saw $506.97 million in gross consideration trade across 31 transactions.
Northern Manhattan saw the strongest quarter-over-quarter gains of any sub-market as four transactions exceeding $20 million pushed dollar, transaction and building volumes to more than double. For the second quarter, Northern Manhattan saw $324.07 million in dollar volume from 24 trades, up 181% and 140%, respectively, from the first quarter.
The Bronx was the only sub-market to register both quarter-over-quarter and year-over-year increases in dollar volume, despite joining Brooklyn as the only locations to see transactions fall against the previous quarter. The Bronx saw 44 buildings sell across 20 transactions totalling $324.54 million in gross consideration, led by two large portfolio deals. These figures represent a 2% decline in building volume, a 35% drop in transactions and a sub-1% rise in dollar volume quarter-over-quarter.
Brooklyn fared well in the second quarter, and narrowly missed leading New York City in dollar volume for the second straight quarter, thanks in large part to three sales that took place north of $75 million. For the quarter, Brooklyn saw 29 sales comprised of 90 buildings totalling $502.28 million in gross consideration. These numbers represent a 26% and 76% improvement in dollar and building volume respectively, but a decrease of 9% in transaction volume compared to the previous quarter.
Queens registered strong gains across the board as a bevy of $10 million transactions and two large portfolio sales boosted the borough’s figures ahead of the previous quarter. For the second quarter, Queens saw 15 transactions consisting of 69 buildings trading for $270.62 million in gross consideration. These numbers are a considerable jump from the first quarter’s 10 trades involving 14 buildings that amounted to $167.98 million in dollar volume.
NYREJ: What do you see on the horizon for the multifamily market this year?
Shkury: A recent pickup in bidding activity on active listings and contract signings indicates we may see things begin to turn around towards the end of the year. We think volume in the second half is looking more positive than the first half. However, the market is extremely event-driven, so we need to watch these events unfold to get more certainty.
Pricing will be a mixed-bag, but some locations will continue to increase in value, while others will plateau. However, we do not expect a big drop-off in pricing anywhere in New York City.
So, while we are holding out for the possibility of a modest pickup in in the second half that will carry into 2018, our baseline expectation is for multifamily volume and pricing to remain stable at current levels through the end of the year.
NYREJ: Where can we get a copy of this report?
Shkury: Ariel Property Advisors’“Multifamily Quarter in Review New York City: Q2 2017” and all of our research reports are available on our website at http://arielpa.nyc/investor-relations/research-reports.
Hanna Commercial Real Estate brokers Agri-Plastics 64,000 s/f manufacturing facility lease at Uniland’s 2 Steelworkers Way


AI comes to public relations, but be cautious, experts say - by Harry Zlokower

Strategic pause - by Shallini Mehra and Chirag Doshi

Lasting effects of eminent domain on commercial development - by Sebastian Jablonski






.jpg)

.gif)