Ariel Property Advisors


New York, NY NYREJ recently sat down with Shimon Shkury, founder and president of Ariel Property Advisors, a New York City investment real estate services and advisory company, who shared some of the highlights from Ariel Property Advisors’ “Multifamily Quarter in Review New York City: Q1 2017.”
 Q: How did the multifamily market perform in the first quarter?
A: The New York City multifamily market continued to cool off in the first quarter as caution surrounding last year’s election suppressed the number of properties that went under contract late last year. Dollar volume dropped to its lowest level in four years as large institutional-level transactions all but vanished. Transaction volume, however, remained on pace with the previous quarter.
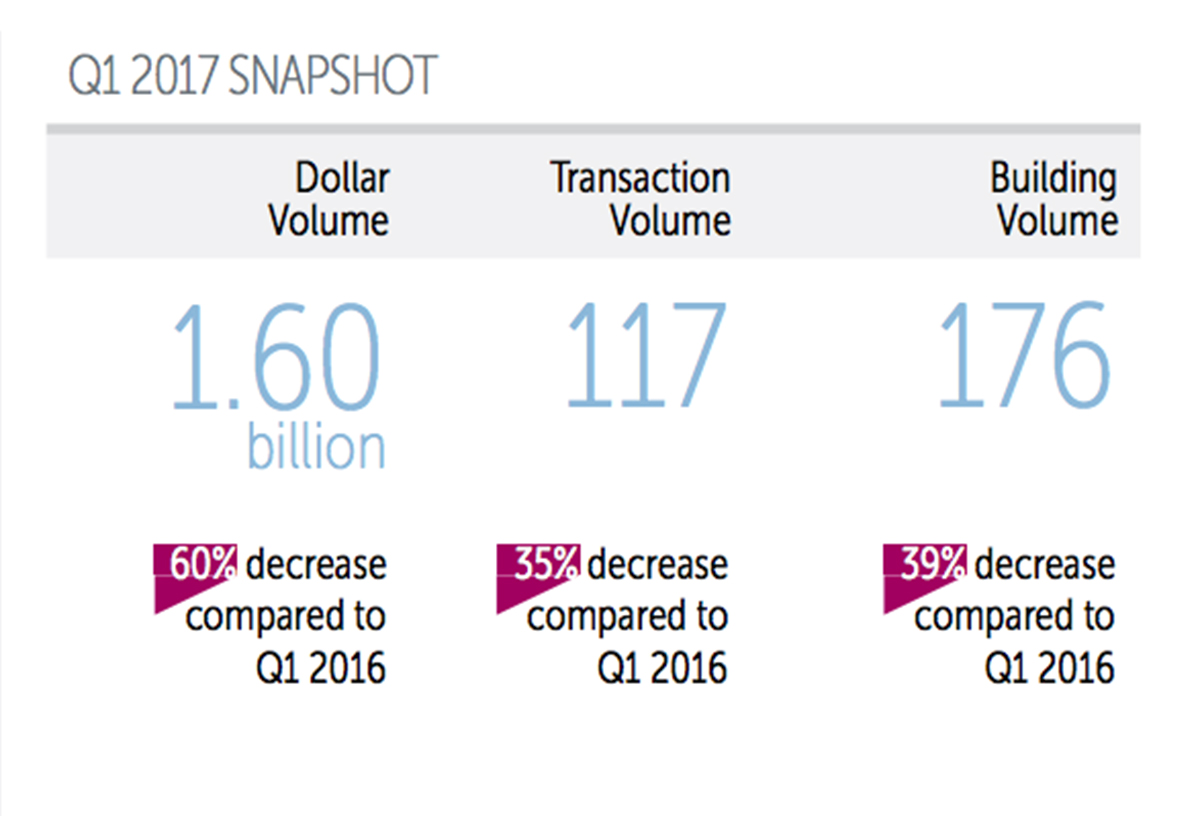
In the first quarter, New York City dollar volume dropped 60% year-over-year to $1.6 billion in gross consideration, its lowest since the first quarter of 2013. Not one transaction exceeded $100 million in the first quarter, paling in comparison to the 11 registered in the fourth quarter of 2016. Moreover, just 16 sales were above $20 million in the period versus 29 in the previous quarter.
New York City saw 117 transactions comprised of 176 buildings in the first quarter, representing annual declines of 35% and 39%, respectively. Transaction volume nearly mirrored the fourth quarter of 2016, which saw 118 deals.
Q: How are multifamily prices holding up?
A: Pricing in the first quarter was mixed, with properties in The Bronx firming the most, while those in Manhattan and Brooklyn softened. Indeed, The Bronx reigned supreme, with price per s/f in the quarter leaping 10% year-over-year.
Based on six-month trailing averages, Manhattan cap rates rose for a third straight quarter, hitting 3.87%, and 22 basis points higher than a year earlier.
Manhattan’s trailing six-month average pricing metrics in the first quarter stood as follows (year-over-year changes):
• Price per s/f at $966 (+1%);
• Price per unit at $690,150 (-2.4%);
• Capitalization rate at 3.87% (-6%); and
• Gross rent multiple at 19.20 (-0.4%).
Northern Manhattan’s trailing six-month average pricing metrics in the first quarter stood as follows (year-over-year changes):
• Price per s/f at $380 (+11%);
• Price per unit at $298,205 (+5.1%);
• Capitalization rate at 3.74% (+6%); and
• Gross rent multiple at 15.91 (+2.5%).
Brooklyn’s trailing six-month average pricing metrics in the first quarter stood as follows (year-over-year changes):
• Average price per s/f at $340 (-14.1%);
• Price per unit at $293,539 (-12.6%);
• Capitalization rate at 4.40% (-2.6%); and
• Gross rent multiple at 16.16 (-5.3%).
The Bronx’s trailing six-month average pricing metrics in the first quarter stood as follows (year-over-year changes):
• Average price per s/f at $190 (+9.6%);
• Price per unit at $166,977 (+10.2%);
• Capitalization rate at 4.99% (+2.5%); and
• Gross rent multiple at 11.99 (+12.1%).
Queens’ trailing six-month average pricing metrics in the first quarter stood as follows (year-over-year changes):
• Price per s/f at $358 (+21.1%);
• Price per unit at $289,941 (+12.3%);
• Capitalization rate at 3.85% (+10.9%); and
• Gross rent multiple at 16.33 (+14.4%).
Q: How did the submarkets perform in the first quarter?
A: Manhattan experienced a tepid first quarter, with just 27 transactions comprised of 32 buildings, totaling $512.63 million in gross consideration, representing declines of 16%, 29%, and 69%, respectively, versus the same quarter a year earlier.
Northern Manhattan, one of the most active areas in 2016, saw the most significant decline of any sub-market, with all volume metrics down considerably versus the fourth quarter as well as a year earlier. The region’s transaction-less February played a large role in the quarter’s underperformance. For the first quarter, Northern Manhattan saw just $194.82 million in dollar volume from 13 trades, down 66% and 52%, respectively, from the same quarter a year earlier.
For the quarter, Brooklyn saw 32 sales comprised of 53 buildings totaling $397.58 million in gross consideration. These numbers represent an improvement over the previous quarter, but a year-over-year decrease of 35% in transaction volume and a 52% decline in dollar volume.
The Bronx fared modestly well in the first quarter of 2017, with 33 transactions totaling $275.07 million in gross consideration. These figures represent a 27% increase in transactions and 47% jump in dollar volume quarter-over-quarter despite year-over-year declines of 33% and 52%, respectively.
Queens epitomized a mixed-bag this quarter as the borough saw an increase in transaction volume quarter-over-quarter, but a lack of portfolio trades drove dollar volume lower. For the first quarter, Queens saw just 12 transactions consisting of 17 buildings trading for $220.02 million in gross consideration. These numbers are in stark contrast to first quarter of 2016’s 23 trades involving 30 buildings that amounted to $411.65 million in dollar volume.
Q: What do you see on the horizon for the multifamily market this year?
A: Today’s near-term outlook is more uncertain than in recent years. Hesitation around the election last year had many investors hitting the pause button, which ultimately impacted first quarter volume. Now that the uncertainty has subsided and 10-year yields have come down, we expect to see a sharp pickup in activity.
Meanwhile, higher rental supply has caused free market rents to plateau or fall. However, this supply should take 12-18 months to stabilize and after that, rents should begin to rise again. At the same time, equity investors and funds are still bullish on the market, so there is still plenty of demand for multifamily properties.
Q: Where can we get a copy of this report?
A: Ariel Property Advisors’ “Multifamily Quarter in Review New York City: Q1 2017” and all of our research reports are available on our website at http://arielpa.nyc/investor-relations/research-reports.


