News:
Brokerage
Posted: March 24, 2014
Inflated expectations: Analysis of Manhattan office rents
Recent reports about the Manhattan office leasing market since the crash of 2008 have offered a cautiously optimistic picture of growth. Indeed, at first glance, Manhattan office rents appear to have climbed a healthy percentage since the economic crisis. But how is this analysis affected once inflation is plugged into the effective rent calculation? An examination of inflation-adjusted* lease comp data spanning the past 10 years provides an informed representation, and reflects the "flight from quality" that has been visible across submarkets since rents hit bottom in 2010.
Sluggish A
Adjusted for inflation, Manhattan class A office rents over the past four years show a slow upward movement. While the nominal class A effective rents have grown 13.76% since the crisis, inflation-adjusted rents have increased only 7.36%. A similar trend is observable in Manhattan's Downtown and Midtown, which experienced 3.9% and 8.39% inflation-adjusted increases in effective rent, respectively. This is not surprising, as these submarkets both offer a majority of the class A inventory in Manhattan, which has decelerated along with the financial services sector.
Rise of Classes B and C
Class B and C buildings have fared better than class A following the downturn, with class C in particular having shown significant increases in inflation-adjusted effective rent. Over the past five years, the gap between class B and C rents has narrowed to only $4.74 per s/f, compared with $8.34 in 2009. The growth of class C nominal effective rent since 2010 is 19.53%, and just under 14% when adjusting for inflation, exceeding that of both A and B. Indeed, while current class A and B office rent can be most closely compared to the inflation-adjusted levels of 2006, class C space has risen to near the prices of 2008. This trend can be connected to the post-recession booming technology sector, with tenants like Google favoring class B and C buildings in Midtown South over the corporate quality and higher rents of class A buildings in Midtown.
Class C wins; Moderate
growth for class A and B
Investors may be surprised to learn that the growth of inflation-adjusted effective rent is quite far from the nominal rent growth. While it's clear that class C office space is a hot commodity, and that Midtown and class A are still working on regaining stability, class B's growth has been overrated.
Although growth has not been robust for classes A and B, rents have outpaced inflation and returned to their 2006 levels. The lively leasing activity across Manhattan and an increasing number of leases above $100 per s/f may lead some to assume that the market is preparing for another bubble. However, when compared to the period of 2003 through 2006, rental rates for classes A and B in the past five years appear almost flat. While it is probable that rents across classes and submarkets will grow as the market continues to recover, this will likely be a slow and steady rise as opposed to a giant leap.
*Inflation rate for this article was calculated using month by month CPI data from 2003 through present.
Diana Hill is a research analyst at CompStak, New York, N.Y.
Tags:
Brokerage
MORE FROM Brokerage
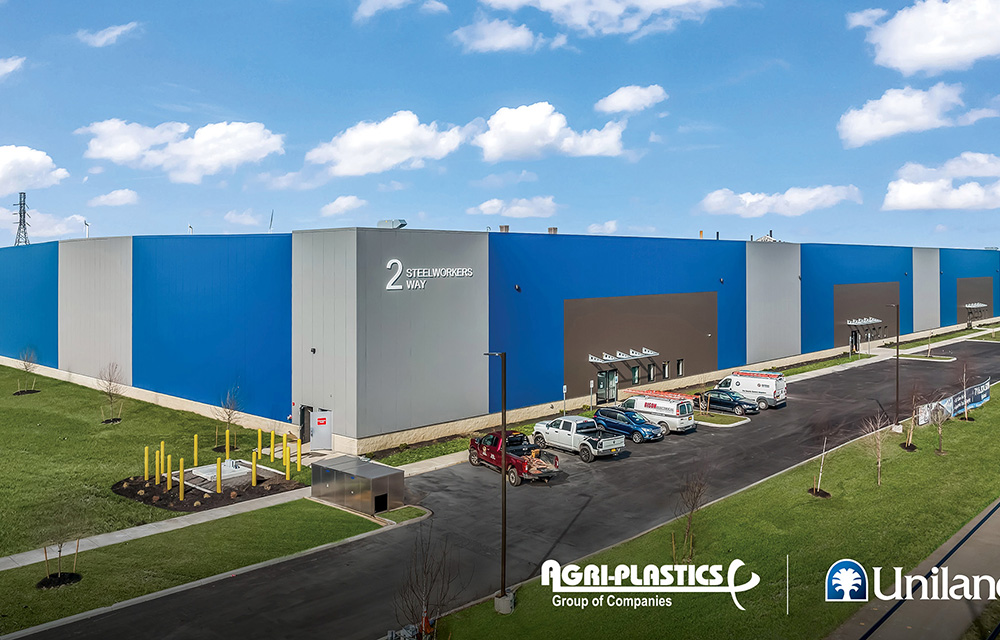
Hanna Commercial Real Estate brokers Agri-Plastics 64,000 s/f manufacturing facility lease at Uniland’s 2 Steelworkers Way
Lackawanna, NY Agri-Plastics, a global leader in the manufacturing of plastic products for agricultural, industrial, recreational, environmental, and home industries, has signed a 64,000 s/f lease to open a

Quick Hits
Columns and Thought Leadership

Lasting effects of eminent domain on commercial development - by Sebastian Jablonski
The state has the authority to seize all or part of privately owned commercial real estate for public use by the power of eminent domain. Although the state is constitutionally required to provide just compensation to the property owner, it frequently fails to account

AI comes to public relations, but be cautious, experts say - by Harry Zlokower
Last month Bisnow scheduled the New York AI & Technology cocktail event on commercial real estate, moderated by Tal Kerret, president, Silverstein Properties, and including tech officers from Rudin Management, Silverstein Properties, structural engineering company Thornton Tomasetti and the founder of Overlay Capital Build,

Behind the post: Why reels, stories, and shorts work for CRE (and how to use them) - by Kimberly Zar Bloorian
Let’s be real: if you’re still only posting photos of properties, you’re missing out. Reels, Stories, and Shorts are where attention lives, and in commercial real estate, attention is currency.

Strategic pause - by Shallini Mehra and Chirag Doshi
Many investors are in a period of strategic pause as New York City’s mayoral race approaches. A major inflection point came with the Democratic primary victory of Zohran Mamdani, a staunch tenant advocate, with a progressive housing platform which supports rent freezes for rent


.jpg)
.gif)
.gif)