
News:
Brokerage
Posted: April 27, 2015
Highlights from DTZ First Quarter Manhattan Office Market Report
The following are highlights and statistics that outline how the market performed during the first quarter of the year from the DTZ First Quarter Manhattan Office Market Report. The full report is available at: You can view the full report here: http://ge.tt/3gcNucD2/v/0.
Economy
The New York City economy remains robust at the start of 2015, as total employment continued to surpass all-time high employment numbers with over 4.1 million jobs in the city through February 2015. Office-using employment continued to grow as well, with 38,600 office jobs created in the past year. The majority of the office-job creation was in the professional services sector, which added 26,100 jobs in the past 12 months. The financial services sector added 9,300 jobs in the past year, which is the most significant growth created in this sector since 2007. Year-over-year unemployment numbers are strong as well, as the New York City rate is down 130 basis points to 7.2% through February. With no signs of the economic expansion slowing, the Manhattan office market should remain strong through 2015.
Overview
Following a stellar 2014, the Manhattan office market hit a minor roadblock in the first quarter 2015 as over 1.7 million s/f of negative absorption was posted. This trend is nothing new for the current recovery cycle, as absorption has been negative in the first quarter in three of the past four years. The strength of the market, however, has led to positive absorption by the end of each of those years, which will likely be the case in 2015 as well. The negative absorption can mostly be attributed to 33 buildings adding more than 45,000 s/f to the market, which led to a 50-basis-point-jump in the availability rate to 9.8%.
The bulk of the increase in supply was in the Class B market, as it accounted for 15 of the 33 buildings each with greater than 45,000 s/f added to the market and totaled over 1.2 million s/f of negative absorption. Despite a 100-basis-point-jump in availability to 9.3%, Class B average asking rents increased 1.2% since last year to $59.97 per square foot. As Class B space has been in high demand over the past several years, expect most of this space, if not all, to be absorbed in 2015.
The Class A availability rate rose only 30 basis points to 10.3%, and accounted for 17 of the 33 buildings that added more than 45,000 s/f to the market. Class A asking rents dipped slightly in the first quarter, down 1.0% to $76.51 per square foot. The decrease in rent is not due to the market weakening, but was caused mostly from a significant block of space hitting the market Downtown at a lower price than both the Manhattan average and Midtown South's high-end space.
Economic Indicators
Midtown
* The Midtown market started the year off slow, as the availability rate increased 20 basis points to 9.9% in the first quarter.
* Over 450,000 s/f of negative absorption was posted as 17 buildings each placed 45,000 s/f or greater on the market.
* With all of the negative absorption occurring in the Class B market this year, this marks the second consecutive quarter in which Class A space was in higher demand.
* Midtown Class A asking rents rose minimally, up only $0.24 per square foot to $84.98.
* Park Avenue was the only submarket to post a significant Class A rental increase in the first quarter, up $1.91 to $98.89 per square foot.
* Class B asking rents actually dropped $0.26 per square foot to $61.09, as five significant blocks of space hit the market priced below the Midtown Class B average.
Midtown South
* Midtown South was the only market to post positive absorption and start off 2015 right where 2014 ended.
* Availability dropped 40 basis points to 6.6%, as over 339,000 s/f of positive absorption was recorded.
* Although eight buildings each placed 45,000 s/f or more on the market, demand remained strong in the first quarter as leasing activity outpaced space returns.
* The market continues to tighten as four out of five submarkets have availability rates below 7.0%, with the SoHo/NoHo/Village submarket having a 10-year-low availability rate of 3.2% - the lowest in Manhattan. Midtown South Class A asking rents dipped $0.11 per square foot to $75.44 in the first quarter, mostly due to no direct available space in the SoHo/NoHo/Village submarket, which was previously averaging asking rents over $101.00 per square foot.
× Midtown South Class B asking rents jumped $1.45 per square foot to $68.73, which is 35.8% higher than the previous market high in 2008.
Downtown
× After a phenomenal year in 2014, Downtown struggled through the first quarter 2015, as eight buildings brought a total of 2.1 million s/f to the market.
× The biggest space to hit the market with over 984,000 s/f was 28 Liberty Street, which contributed to the 220-basis-point-increase in availability to 12.6%.
× Demand slowed in the first quarter with only one lease greater than 100,000 s/f signed, as WeWork leased 240,000 s/f at 85 Broad Street.
× Despite a slowdown in the Downtown market, both Class A and Class B asking rents increased. Class A asking rents are up $1.65 per square foot to $61.61 and Class B asking rents rose $0.70 to $44.02 per square foot.
Outlook
× Despite a weak first quarter, expect the market to bounce back over the next three quarters as leasing activity picks up.
× Additional Class B space on the market will create more opportunities for tenants searching for space in the $55.00 to $65.00 per square foot range in 2015.
× Lack of available supply in Midtown South will push more tenants to Midtown and Downtown.
Tags:
Brokerage
MORE FROM Brokerage
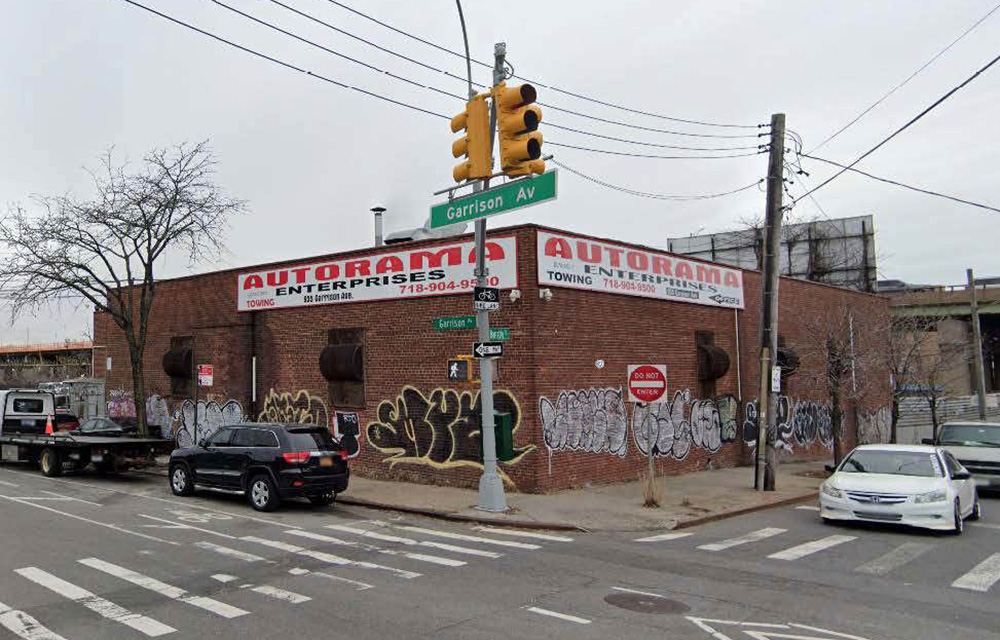
Marcus & Millichap brokers sale of $10.28 million industrial property in the Bronx
Bronx, NY Marcus & Millichap negotiated the $10.275 million sale of an industrial property at 935 Garrison Ave. “This transaction reflects both the depth of demand for NYC industrial outdoor storage


Columns and Thought Leadership

The anticipated effect of Basel III and ISO 20022 implementation on commercial real estate - by Michael Zysman
July 1, 2025 is the deadline for US banks to begin to adopt Basel III banking standards and July 14, 2025 is the deadline for U.S. banks to adopt ISO 20022 messaging standards. Both will have a significant effect on the banking and commercial real estate (CRE) finance sectors.

A fresh start - by Shallini Mehra and Amit Doshi
For the past several years, the New York City multifamily housing market has been defined by disruption. The combined impact of the HSTPA rent laws and a sharply higher interest rate environment has fundamentally reduced

The death of the generic offering memorandum: What buyers expect in 2025 - by Kimberly Zar Bloorian
There was a time when an offering memorandum (OM) was pretty bare bones, some photos, a few bullet points on income, and a rent roll thrown in at the back. That used to get the job done. Not anymore. In 2025, buyers are sharper, faster, and more selective. They’re looking

Tri-state capital migrates nationally amid regulation pressure - by Reese Weaver
New York tri-state multifamily investors are increasingly reallocating capital to less-regulated markets across the U.S. as rent control and legislative risk erode returns at home. With over 60% of New York City’s rental housing stock classified as rent-stabilized, the traditional value-add model — buying under-performing buildings,
.gif)