News:
Brokerage
Posted: November 10, 2014
Cap-rate comedy: When in doubt "use a cap-rate of 10%"
The proper full terminology of a "cap-rate" for the purpose of this article is: "overall capitalization rate" which is the ratio of net operating income (NOI) divided by overall property value. So when you see "cap-rate;" think overall capitalization rate. When I started to learn the ropes of the appraisal profession in the early 1970s, the standing lame joke among lenders, brokers and investors at professional meetings and luncheons was when in doubt use a cap-rate of 10%. It did generate a lot of nervous giggles from appraisers including myself who was getting my feet wet. In some respects this standing joke was not far from reality. From my recollection; lenders, brokers and investors automatically and sometimes in jest thought 10% cap-rates were the norm. I suppose they drew that conclusion from reading appraisal reports over that time period. This thinking was a double-edged sword. In one respect it may have been a reasonable generalization given the time period. However, most appraisers knew it as an oversimplification and would lead to erroneous values if relied upon by non appraisers. It goes to the old adage which states "a little knowledge can be dangerous." This doesn't even consider the variation of cap-rates by different individuals who have different philosophies on reserves and management fees. Some brokers and investors don't consider management and reserves as a stabilized expense. Thus, their cap-rates will be higher than most appraisers who consider management and reserves as a stabilized expense.
By using statistics, there are pertinent terms such as average, median, and mode. The average is the result of taking the sum of the sample and dividing by the number in the sample. The median represents the point in the sample in which 50% of the sample are above the median and 50% are below the median. The mode is what specific number in the sample repeats itself most frequently. Hypothetically, if the overall capitalization rate mode approximately 40 years ago was 10%, it may be part of urban appraisal legend. However, even in the 1970s this was an over simplification. The Ellwood formulation and the band of investment techniques were relied upon heavily to estimate capitalization rates during that time period. So the hypothetical 10% cap-rate could be arrived at if the sample were cap-rates of 8% and 12%; a variance of 50% from 8% and 33% from the 12% prospective. That's a large variance. This is due to a combination of mixing different property types, ages, lease status, quality, etc. Real estate investing was much simpler because there was not as many complexities in the tax laws. There were less tax credits and other tax shelter avenues. Also, interest rates and alternative investment rates were not at some of the lowest points in modern times as they are today. In the current market there is probably more variation and definitely lower cap-rates compared to 40 years ago because of current tax shelter benefits and low interest rates. To get a better perspective on this topic, I randomly selected 23 cap-rates which were used in appraisals in 2014. There was wide variety of property types including office, retail, multifamily, industrial, mixed use, etc. The "average" cap-rate was 8.29%; the "median" cap-rate 8.25% and the "mode" cap-rate was 9%. Although the average and median were similar, the mode was not. A sample size of 23 is probably too small to put together a proper bulk comparison. However, the variation between the average/median and the mode shows that generalization of cap-rates in today's market is misleading. Regardless, the 8.29% average, 8.25% median and 9% mode is low relative to the hypothetical 10% general cap rate of 40 years ago. Currently, in Upstate New York and parts of New England, cap-rates for class A office space has a predominant range of 7-8%. Class B office space has a prominent average range of 8.5-9.25%. Community shopping centers have a predominant range of 8-8.75%. Light industrial has a predominant cap average range of 8.25-9%. Existing suburban apartment projects have a predominant cap average range of 7-8% and new apartment projects 6-7%.
In summary, 40 years ago hypothetical universal cap-rates of 10% were probably somewhat of an "urban legend" even in the suburbs. Generalization of any property cap-rate is unsound; even 40 years ago when methodology was less complex. The same applies today because every property is different. The joke will be on those comedians who use generalized capitalization rates.
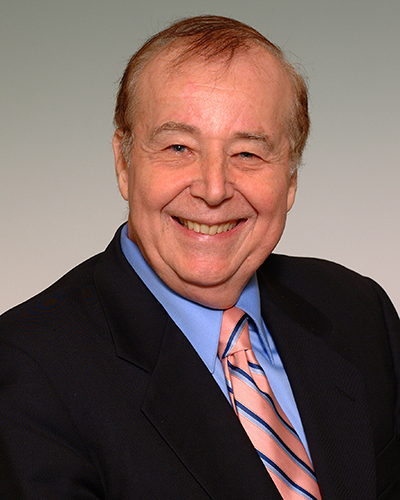
John Rynne, MAI, SRA is the president and owner of Rynne, Murphy & Associates, Inc., Rochester, N.Y.
Tags:
Brokerage
MORE FROM Brokerage
JLL Capital Markets facilitates $30.75 million sale of 1 North Main St. to KABR Group
Port Chester, NY JLL Capital Markets has arranged KABR Group’s $30.675 million acquisition of 1 North Main St., a newly constructed mixed-use multifamily and retail development.

Quick Hits
Columns and Thought Leadership

Strategic pause - by Shallini Mehra and Chirag Doshi
Many investors are in a period of strategic pause as New York City’s mayoral race approaches. A major inflection point came with the Democratic primary victory of Zohran Mamdani, a staunch tenant advocate, with a progressive housing platform which supports rent freezes for rent

Behind the post: Why reels, stories, and shorts work for CRE (and how to use them) - by Kimberly Zar Bloorian
Let’s be real: if you’re still only posting photos of properties, you’re missing out. Reels, Stories, and Shorts are where attention lives, and in commercial real estate, attention is currency.
AI comes to public relations, but be cautious, experts say - by Harry Zlokower
Last month Bisnow scheduled the New York AI & Technology cocktail event on commercial real estate, moderated by Tal Kerret, president, Silverstein Properties, and including tech officers from Rudin Management, Silverstein Properties, structural engineering company Thornton Tomasetti and the founder of Overlay Capital Build,

Lasting effects of eminent domain on commercial development - by Sebastian Jablonski
The state has the authority to seize all or part of privately owned commercial real estate for public use by the power of eminent domain. Although the state is constitutionally required to provide just compensation to the property owner, it frequently fails to account




.jpg)
.gif)
.gif)