Ariel Property Advisors shares “Multifamily Quarter in Review: Q1 2018” - Shimon Shkury
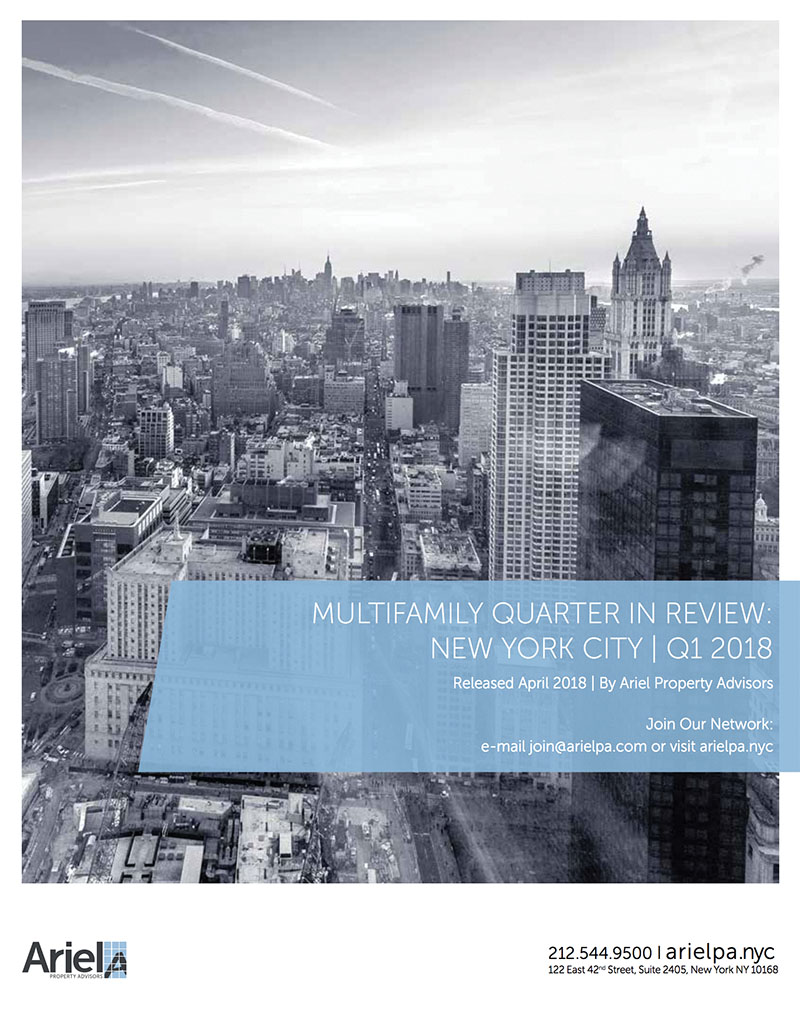
NYREJ recently sat down with Shimon Shkury, founder and president of Ariel Property Advisors, a New York City investment real estate services and advisory company, who shared some of the highlights from Ariel Property Advisors’ “Multifamily Quarter in Review New York City: Q1 2018.”
Q: How did the multifamily market perform in the first quarter?
A: Fervor for New York City multifamily properties gained considerable traction in the first quarter, with volume metrics recording sizeable increases on both a quarter-over-quarter and annual basis. Several large institutional sales in Manhattan helped dollar volume skyrocket to nearly $3 billion, reaching its highest level in over a year.
UploadsInvestor enthusiasm for the asset class emerged during the latter half of 2017, but it accelerated during the first quarter, particularly in February and March. Dollar volume topped $2 billion for a second consecutive quarter. Transactions that exceeded $100 million, which were nonexistent in the same quarter a year earlier, made a comeback. Transaction volume hit a one-year high, a testament to broad strength in the market.
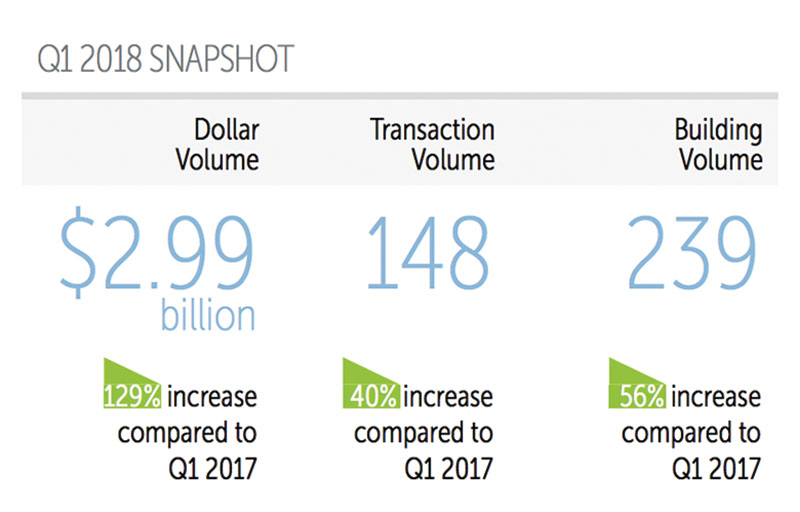
From January through March, New York City’s dollar volume totalled $2.99 billion in gross consideration, its highest level since the fourth quarter of 2016, and a remarkable 129% increase from the same period in 2017. The city saw 148 multifamily transactions comprised of 239 buildings, a surge of 40% and 56%, respectively. On a quarter-over-quarter basis, dollar, transaction and building volume vaulted 30%, 18%, and 26%, respectively.
Q: How are multifamily prices holding up?
A: Pricing metrics, according to a trailing six-month average ending in March, were mixed. The average price per square foot rose in Brooklyn, fell slightly in Manhattan, and held steady in Northern Manhattan, The Bronx and Queens. Brooklyn saw a 15% increase in average price per square foot and a 6% decline in cap rates, the sharpest percentage changes across all sub-markets.
Manhattan’s trailing six-month average pricing metrics in the first quarter stood as follows (year-over-year changes): Price per s/f at $928 (-4.1%), price per unit at $697,360 (+1.0%), capitalization rate at 3.79% (+2.3%), and gross rent multiple at 17.81 (-7.3%).
Northern Manhattan’s trailing six-month average pricing metrics in the third quarter stood as follows (year-over-year changes): Price per s/f at $378 (+2.2%), price per unit at $329,983 (+13.0%), capitalization rate at 3.86% (+2.7%), and gross rent multiple at 15.31 (-4.1%).
The Bronx’s trailing six-month average pricing metrics in the first quarter stood as follows (year-over-year changes): Price per s/f at $196 (+1.0%), price per unit at $177,195 (+4.6%), capitalization rate at 5.21% (+3.0%), and gross rent multiple at 11.61 (-1.0%).
Brooklyn’ trailing six-month average pricing metrics in the first quarter stood as follows (year-over-year changes): Price per s/f at $412 (+15.1%), price per unit at $365,903 (+22.2%), capitalization rate at 4.37 (-6.0%), and gross rent multiple at 15.79 (-0.3%).
Queens’ trailing six-month average pricing metrics in the first quarter stood as follows (year-over-year changes): Price per s/f at $353 (-1.9%), price per unit at $283,150 (-2.5%), capitalization rate at 4.46% (+3.0%), and gross rent multiple at 15.93 (+0.8%).
Q: How did the submarkets perform in the first quarter?
A: On a sub-market level, Manhattan enjoyed a stellar 1Q, recording nearly half of the market’s dollar volume. For the quarter, Manhattan saw $1.40 billion in gross consideration, representing a remarkable quarter-over-quarter gain of 63%. The sharp increase can be attributed to two institutional sales exceeding $250 million, and one above $100 million. The 36 transactions in the sub-market saw the sale of 42 buildings, representing declines of 3% and 11%, respectively.
Northern Manhattan underperformed on a quarter-over-quarter basis. While transaction volume held steady, building and dollar volume slid 11% and 38%, respectively. The 22 transactions in the region saw the sale of 41 buildings for a total consideration of $383.11 million. On a year-over-year basis, however, Northern Manhattan shined bright as it was the only sub-market to register triple-digit percentage increases in all three volume metrics
The Bronx experienced a banner quarter, with every volume metric up substantially versus the previous quarter. The 31 transactions in the area saw the sale of 67 buildings for a total consideration of $359.96 million, representing increases of 19%, 86% and 25%, respectively. On a year-over-year basis, transaction volume was flat, but building and dollar volume rose 49% and 11%, respectively.
Brooklyn witnessed an outstanding 1Q, with transaction volume the highest of any sub-market. The 45 transactions–the highest amount in two years–resulted in a 73% increase versus the prior quarter. New York City’s largest borough saw $625.67 million in dollar volume, a remarkable 147% higher than the fourth quarter, and the sharpest percentage increase of any sub-market. Building volume, meanwhile, stood at 68, an 84% increase from the previous quarter.
Queens lagged in activity in the quarter as it continued to be the least transactional sub-market. The borough’s 14 transactions did not affect transaction volume compared to the previous quarter. Dollar volume dropped 24% to $219.18 million and building volume fell 13% to 21 properties. The only sale of note during the period was the sale of 04-25 56th Ave. for $56.5 million.
On a neighborhood level, the Upper East Side was far and away the most active area in Manhattan during the first quarter, with the neighborhood registering 15 transactions that sold for $270.7 million. Washington Heights was the most transactional region in Northern Manhattan during the first quarter, with the neighborhood registering 11 sales that sold for $122.79 million.
Meanwhile, the neighborhood of Highbridge in The Bronx registered the strongest transaction and dollar volume, with eight sales totaling $158.11 million. The nine transactions in Flatbush were the most in Brooklyn, while Crown Heights led dollar volume at $110.25 million. At $179 million, Far Rockaway notched the highest dollar volume in Queens.
Q: What do you see on the horizon for the multifamily market this year?
A: Larger transactions, which were absent last year, emerged once again in the first quarter, while the pricing gap between buyers and sellers narrowed. However, well-positioned quality multifamily properties are still in high demand and therefore, maintained their pricing level as evident in the larger transactions in the first quarter of this year.
The first quarter’s acceleration in bidding activity on active listings and contract signings indicates the market has turned around. Pricing will be a mixed-bag, but some locations will continue to increase in value, while others will hold steady. Multifamily assets in sub-markets will likely outperform Manhattan. However, we do not expect a big drop-off in pricing anywhere in New York City.
So, while we are optimistic that the pickup in activity in recent months will carry into the rest of 2018, our baseline expectation is for multifamily transaction volume to increase and pricing to remain stable at current levels over the next year.
Q: Where can we get a copy of this report?
A: Ariel Property Advisors’“Multifamily Quarter in Review New York City: Q1 2018” and all of our research reports are available on our website at http://arielpa.nyc/investor-relations/research-reports.
Shimon Shkury is the founder and president of Ariel Property Advisors, New York, N.Y.
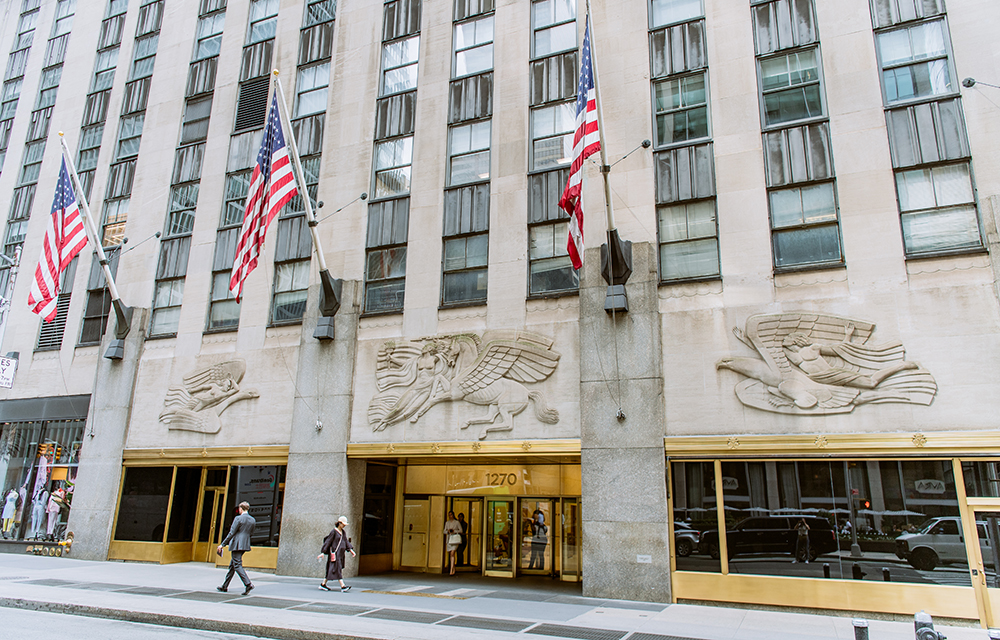
Horizon Kinetics relocates new headquarters to Tishman Speyer’s Rockefeller Center

AI comes to public relations, but be cautious, experts say - by Harry Zlokower

Strategic pause - by Shallini Mehra and Chirag Doshi

Behind the post: Why reels, stories, and shorts work for CRE (and how to use them) - by Kimberly Zar Bloorian




.jpg)
.gif)
.gif)