


News:
Movers & Milestones
Posted: October 28, 2026
Alpha Realty’s quarterly market report – third quarter 2026
NYC Multifamily Market Overview – Q3 2026
New York City’s multifamily market showed mixed results in Q3 2026. It recorded 256 transactions, down 15.8% quarter-over-quarter but up 3.2% year-over-year. Total dollar volume edged up to $1.56 billion, an increase of 2.1% from Q2 but 32.1% below Q3 2025. Units traded fell 20.1% quarterly to 4,987. Fewer deals and a higher average deal size of $6.1 million (+3.3% QoQ) suggest buyers are getting more selective as borrowing costs rise. The Fed raised rates to 3.75%–4.00% in September, its first hike since 2023, and the 10-year Treasury yield rose from 4.44% to 5.29% over the quarter, topping 5% for the first time since 2007. Smaller buildings with fewer than 10 units were the standout segment: they held steady at 148 deals (+20.3% YoY), and their dollar volume rose 36.6% quarter-over-quarter to $493.1 million. Large buildings with 20 or more units fell to 72 transactions (-35.7% QoQ) but still generated $868.9 million, 56% of citywide volume. At the borough level, Manhattan led in dollar volume, Brooklyn stayed the most active by deal count, Queens’ dollar volume rebounded, and the Bronx gave back much of its Q2 gains.
Manhattan
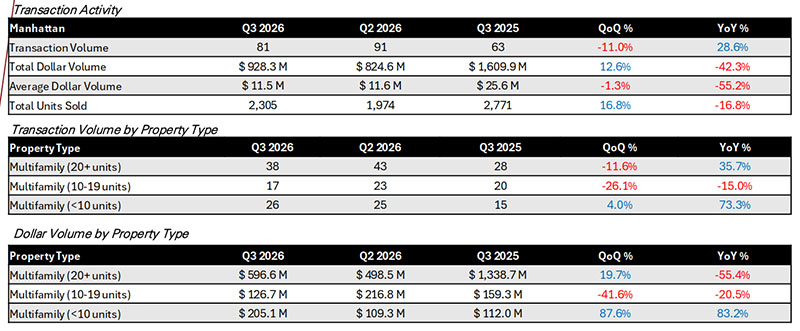
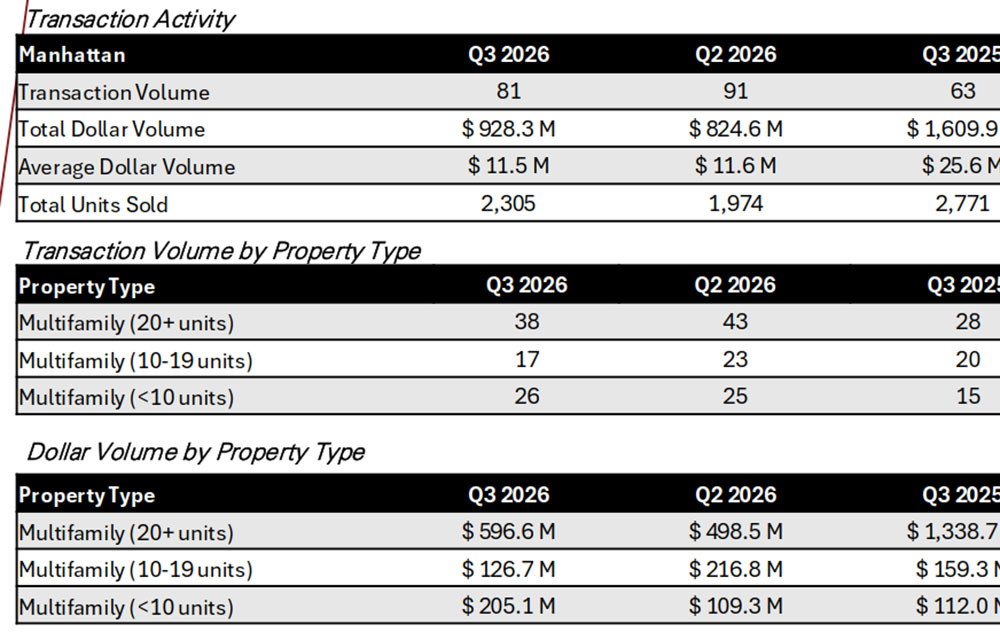
Manhattan gained momentum in Q3 2026, recording 81 transactions totaling $928.3 million. Dollar volume rose 12.6% quarter-over-quarter and made up about 60% of all citywide volume. Transaction count dipped 11% from Q2 but was 28.6% above Q3 2025, and units sold rose 16.8% quarterly to 2,305. Buildings with 20 or more units accounted for 38 transactions and $596.6 million (+19.7% QoQ), including three trades of $80 million or more. The largest was the $103.9 million sale of 260 W 52nd St. in Times Square. Smaller properties were especially strong: dollar volume for buildings under 10 units rose 87.6% quarter-over-quarter and 83.2% year-over-year, led by two SoHo buildings on Greene St. that sold for a combined $60 million. Even after the Fed’s September hike, investors kept buying well-located Manhattan assets.
Brooklyn
Brooklyn remained New York City’s most active borough by transaction count, with 110 multifamily sales in Q3 2026, down 5.2% from Q2 but up 12.2% year-over-year. Total dollar volume rose to $441.9 million (+7.3% QoQ, +7.1% YoY), and the average transaction size grew to $4.0 million. Buildings with fewer than 10 units drove the quarter, with 90 of the borough’s 110 transactions and $236.2 million in dollar volume, up 23.6% quarter-over-quarter and 30.1% year-over-year. Large-property activity thinned out, with only 7 transactions in buildings of 20 or more units. Even so, the $122.5 million sale of 118 Hope St. in Williamsburg kept that segment’s dollar volume 4.5% above last year. Brooklyn shows broad demand for walk-ups, while its larger deals depend on a handful of well-capitalized buyers.
Queens
Queens steadied in Q3 2026 after a sharp slowdown in Q2. It recorded 33 transactions (-2.9% QoQ), and total dollar volume rebounded 43% to $100.1 million. Units sold rose 47.1% quarterly to 515. The recovery came from larger assets: buildings with 20 or more units more than doubled to 9 transactions, and dollar volume in that segment climbed 160.9% to $55.6 million. The largest was the $11.5 million sale of 109-01 72nd Rd. in Forest Hills. The 10–19-unit segment also doubled its dollar volume, to $10.4 million. Smaller properties pulled back to 20 transactions (-25.9% QoQ), and the average deal size rose 25.6% to $3 million. Activity is still below last year’s pace (-29.8% YoY in deal count), but renewed interest in larger buildings suggests investors still see long-term value in Queens.
Bronx
The Bronx gave back much of its Q2 rebound in Q3 2026. Transactions fell to 32 (-49.2% QoQ, -13.5% YoY), and total dollar volume dropped to $84.8 million (-60.8% QoQ, -31.1% YoY). Units sold fell to 1,064. Large-property activity drove the decline: buildings with 20 or more units slid to 18 transactions worth $58.6 million, down from 45 deals and $179.9 million in Q2. The average transaction size fell 37.6% to $2.7 million. Rent-stabilized buildings remain under pricing pressure. A six-building, 306-unit portfolio around Creston Ave. sold for $15 million, about $55 per s/f. Smaller properties held up better, with transactions involving fewer than 10 units up 50% year-over-year and dollar volume up 51%. With the rent freeze in effect and the 10-year Treasury above 5%, Bronx buyers remain highly price-sensitive.
Market Takeaways & Investor Outlook
The NYC multifamily market held its ground in Q3 2026 despite a tougher capital-markets backdrop. Dollar volume edged up 2.1% quarter-over-quarter even as transaction count fell 15.8%, a sign that buyers are still active but more selective. The Fed’s September rate hike, energy-driven inflation of 3.4%, and a 10-year Treasury yield above 5% pushed borrowing costs up. As a result, capital concentrated on well-located assets and on smaller buildings with simpler underwriting. The sub-10-unit segment was the clear winner, with dollar volume up 36.6% quarter-over-quarter and 39.1% year-over-year. Large-scale assets kept institutional support through a few major trades of $80 million or more. The Rent Guidelines Board’s rent freeze now applies to stabilized leases starting October 1, which adds pressure on rent-stabilized buildings and reinforces investor preference for free-market and mixed-use properties.
At the borough level, Manhattan dominated with about 60% of citywide dollar volume. Brooklyn stayed the most active market by deal count, driven by deep demand for walk-up buildings. Queens rebounded on renewed interest in larger assets, while the Bronx pulled back sharply as buyers repriced rent-stabilized product. Looking ahead to Q4, higher rates will likely keep buyers disciplined. Well-priced, free-market and mixed-use assets should continue to attract both private and institutional capital, and sellers of rent-stabilized buildings will need to price realistically to transact.
MORE FROM Movers & Milestones
Alpha Realty’s quarterly market report – third quarter 2026
New York City’s multifamily market showed mixed results in Q3 2026. It recorded 256 transactions, down 15.8% quarter-over-quarter but up 3.2% year-over-year. Total dollar volume edged




 (2).gif)