Shkury of Ariel Property Advisors shares “Multifamily Quarter in Review NYC Q3”
 The New York Real Estate Journal recently sat down with Shimon Shkury, founder and president of Ariel Property Advisors, a New York City investment real estate services and advisory company, who shared some of the highlights from Ariel Property Advisors’ “Multifamily Quarter in Review New York City: Q3 2017.”
Q: How did the multifamily market perform in the third quarter?
A: The New York City multifamily market picked up considerable steam in the third quarter, with dollar and transaction volume reaching 2017 highs as investors became more enthusiastic about the asset class. While sales volume in the city remained lower on a year-over-year basis, the climb in activity signifies the market is poised to end the year on solid ground.
After a tepid start to the year, positive momentum that commenced during the latter part of 2Q accelerated in 3Q, with the market topping $2 billion in sales for the first time since the 4Q16. Dollar volume was decisively driven by Manhattan, which saw two sales above $100 million. During the first and second quarter, New York City registered only one sale at that level across all sub-markets.
Another notable 3Q development was transaction volume, which jumped to its highest level since the same quarter in 2016.
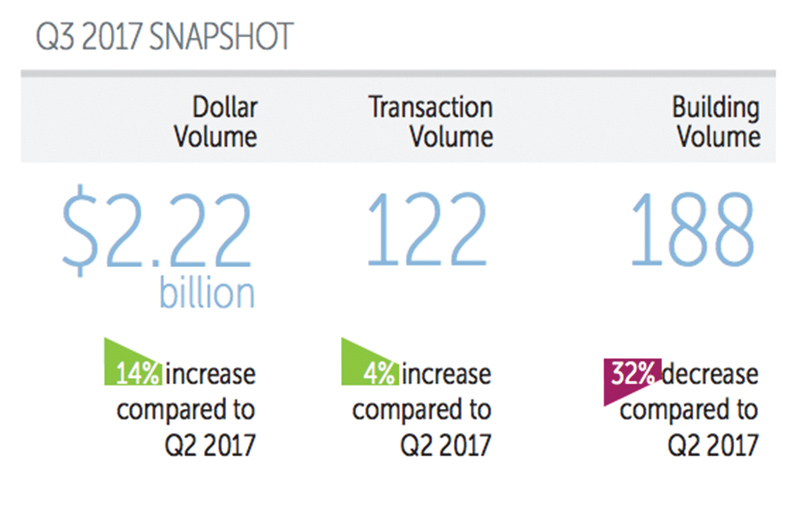
From July through September, New York City saw 122 multifamily transactions comprised of 188 buildings totaling $2.22 billion in gross consideration. This represents a 14% increase in dollar volume, a 4% rise in transaction volume, and a 32% decrease in building volume compared to the second quarter. However, when compared to the same quarter in 2016, third quarter dollar, transaction and building volume declined 24%, 24% and 27%, respectively.

Q: How are multifamily prices holding up?
A: Pricing appreciated year-over-year in The Bronx and Queens, while other sub-markets saw mixed results. The Bronx saw the most sizeable appreciation, with the average price per s/f leaping 10%, reaching $200 for the first time on record.
Manhattan’s trailing six-month average pricing metrics in the third quarter stood as follows (year-over-year changes): price per s/f at $934 (-2.8%), price per unit at $682,464 (+3.8%), capitalization rate at 3.53% (+1.7%), and gross rent multiple at 19.91 (-1.8%).
Northern Manhattan’s trailing six-month average pricing metrics in the third quarter stood as follows (year-over-year changes): price per s/f at $393 (+10.2%), price per unit at $332,973 (+7.5%), capitalization rate at 4.16% (-4.5%), and gross rent multiple at 15.79 (+1.5%).
The Bronx’s trailing six-month average pricing metrics in the third quarter stood as follows (year-over-year changes): price per s/f at $200 (+10.1%), price per unit at $178,181 (+12.5%), capitalization rate at 4.93% (+7.2%), and gross rent multiple at 12.02 (+8.6%).
Brooklyn’s trailing six-month average pricing metrics in the third quarter stood as follows (year-over-year changes): price per s/f at $398 (+7.4%), price per unit at $310,864 (-5.2%), capitalization rate at 4.27% (+6.6%), and gross rent multiple at 15.42 (-0.6%).
Queens’ trailing six-month average pricing metrics in the third quarter stood as follows (year-over-year changes): price per s/f at $384 (+9.1%), price per unit at $292,176 (+3.1%), capitalization rate at 3.97% (+4.6%), and gross rent multiple at 15.91 (+3.4%).
Q: How did the submarkets perform in the third quarter?
A: On a neighborhood level, Washington Heights was far and away the most active area in Northern Manhattan during the third quarter, with the neighborhood registering nine transactions that sold for $160.33 million. In Manhattan, the Garment Center led the way with $320 million in sales in the quarter.
Meanwhile, Brooklyn Heights notched the highest dollar volume in Brooklyn during the third quarter, with $63.50 million. Flatbush also fared well, with $45.05 million in sales across four transactions. In The Bronx, Kingsbridge Heights saw the most dollar in the quarter with $52.20 million, while Jamaica led dollar volume in Queens, registering $20 million.
On a sub-market level, Manhattan was a standout in 3Q, registering its strongest quarter of the year, and recording nearly as much dollar volume as the rest of the market combined. For the quarter, Manhattan saw $1.08 billion in gross consideration, representing a remarkable quarter-over-quarter gain in dollar volume of 120%, while transactions held steady at 30.
Northern Manhattan also enjoyed a banner quarter, registering across-the-board gains. In fact, it was the only sub-market to register increases in the number of sales year-over-year, with 24 transactions consisting 31 buildings taking place. Five sales above $20 million pushed dollar volume to $364.55 million, the highest total in Northern Manhattan since the 4Q16.
The Bronx experienced a mixed 3Q, notching gains in transaction and building volume, but declines in dollar volume due to a dichotomy of transactions. On the one hand, 50% of the transactions were less than $5 million, while on the other hand, four larger portfolio sales pushed the number of buildings sold higher. In total, the borough saw 24 transactions consisting of 49 buildings totaling $249.96 million in gross consideration.
Brooklyn’s 36 transactions were the most for the borough in a quarter since 3Q16, resulting in a 29% increase against 2Q17. However, the borough’s $444.07 million in dollar volume was short of the previous quarter’s total of $467.93 million, and substantially lower than the same period last year, which notched $686.96 in sales.
Queens activity was extremely lackluster in 3Q, with the borough experiencing steep declines across the board. The sub-markets’ eight transactions were the fewest in a quarter since 4Q11 and dollar volume fell below $100 million for the first time since 2Q14.
Q: What do you see on the horizon for the multifamily market next year?
A: The third quarter’s acceleration in bidding activity on active listings and contract signings indicates the market has turned around after a sluggish start to the year. We think volume in the second half of the year will be more positive than the first half, but the market is extremely event-driven. While interest rates are on the rise, they remain historically low, which bodes well for real estate financing throughout New York City.
Pricing will be a mixed-bag, but some locations will continue to increase in value, while others will plateau. Multifamily assets in sub-markets will likely outperform Manhattan. However, we do not expect a big drop-off in pricing anywhere in New York City.
So, while we are optimistic that the pickup in activity in recent months will carry into 2018, our baseline expectation is for multifamily volume and pricing to remain stable at current levels over the next year.
Q: Where can we get a copy of this report?
A: Ariel Property Advisors’“Multifamily Quarter in Review New York City: Q3 2017” and all of our research reports are available on our website at http://arielpa.nyc/investor-relations/research-reports.
Shimon Shkury is the founder and president of Ariel Property Advisors, New York, N.Y.