Another thing 2020 stunk at…Benchmarking utility data - by Kenneth Wille

Benchmarking is comparing yourself to others to determine how you are doing. We all benchmark data whether we realize it or not. Your new vehicle gets 31 mph which is best in class? Benchmarking. Scored in the top 10 percentile on a test? Benchmarking. Ranked 2,051 or 5,092 in your Peloton Hip Hop HIIT Ride? You get the idea. So, when it comes to utility data (electric, water, natural gas use) the idea of benchmarking compares one period (usually 12 or 24 months) to similar buildings to grade how your building performs for hot water, heating, cooling, etc. Well, what happens when everything changes early in 2020 to how we “use” utilities? Does that impact overall usage which then makes for an atypical period that should be not used for comparison in the future? The answers are that a lot happens and yes, it impacts it greatly. Here are few of the more interesting human behavior impacts to utility use due to COVID-19 in 2020.

Electricity a Shocking Change?
According to the Diana Sabau from the Commercial Café Blog on 10/19/2020, U.S. demand was down through June 2020 versus 2019. (See Chart 1)
Makes sense. We were all home and not shopping, while hospital and medical offices were, unfortunately, extremely busy. In Washington D.C. usage was down 16% in Q2 as government activity and services slowed. The biggest commercial drop statewide was Hawaii with a 22% reduction due to the impacted hospitality industry and school shutdowns.

Water Usage
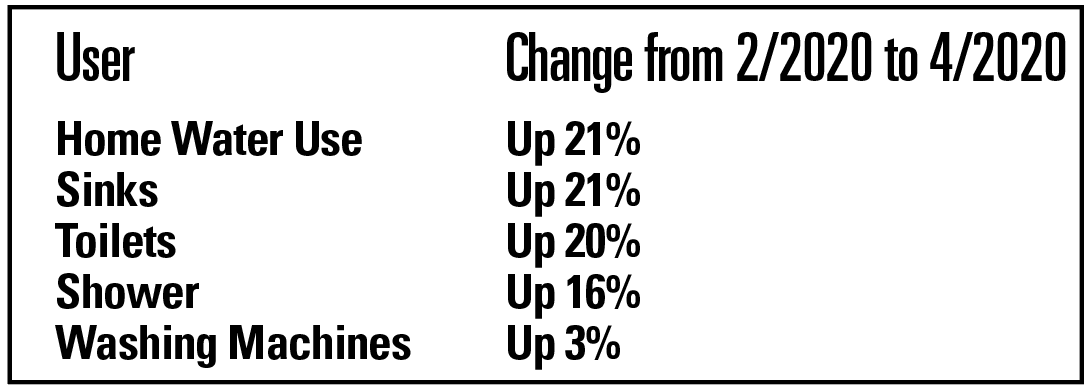
When looking at water usage you really get an idea for wastewater flow, as they are directly related. According to Phyn Smart Monitoring Co. (on Techrepublic.com) which monitors water usage throughout the U.S., the fact that we stayed home had pretty logical changes. See Chart 2, comparing February 2020 to April 2020.
Nationally, homes averaged 40 sink visits in February versus 50 in April. The greater water usage is attributed to more hand washing, as well as longer hand washing (sing Happy Birthday twice, right?). Sink visit times went from 11 seconds average to 20 seconds in this same time period. Showering occurred three times more per week per home and more throughout the day as opposed to before and after a business hour work/school day. What is interesting is that New Yorkers used 28% more water daily and flushed 5 times more in April versus February which could also be partially explained by the greater number of renters who do not pay their water bill thus not quite as responsible an oversight.
Gas Need Not Apply
Looking at natural gas is not as eye opening as water and electricity. Ovens can be gas or electric, as can furnaces and water heaters, and without knowing which (or a mix) exists at a certain home or property, it is difficult to focus on changes in behavior and therefore usage. One would rightfully argue that if we are home more, then we are using more gas for hot water and cooking, and I would certainly agree that this makes sense. However, electric and water are “simpler” in this study and they provide the changing use picture that we were looking for.
Conclusion
It would seem that over a long period of time (12 months) anomalies and variances would be less an impact. But to compare electrical and water usage for “typical” users means that we need to compare similar typical periods. The energy benchmarking industry will have to figure out a way to deal with the atypical demand of 2020. I would not be surprised if 2020 were removed when benchmarking a building’s energy use and 2018, 2019, 2021 were used to define an energy profile of the building. Only time will tell, but until we get back to normalcy, I guess all we can do is deal with the impacts of COVID 19…and get ready for our next Peloton ride.
Kenneth Wille, PE is president and CEO of KOW Building Consultants, New York, N.Y.
NYC mayor and DOB release comprehensive façade inspection and safety study conducted by Thornton Tomasetti


.gif)
.jpg)

.gif)